▶
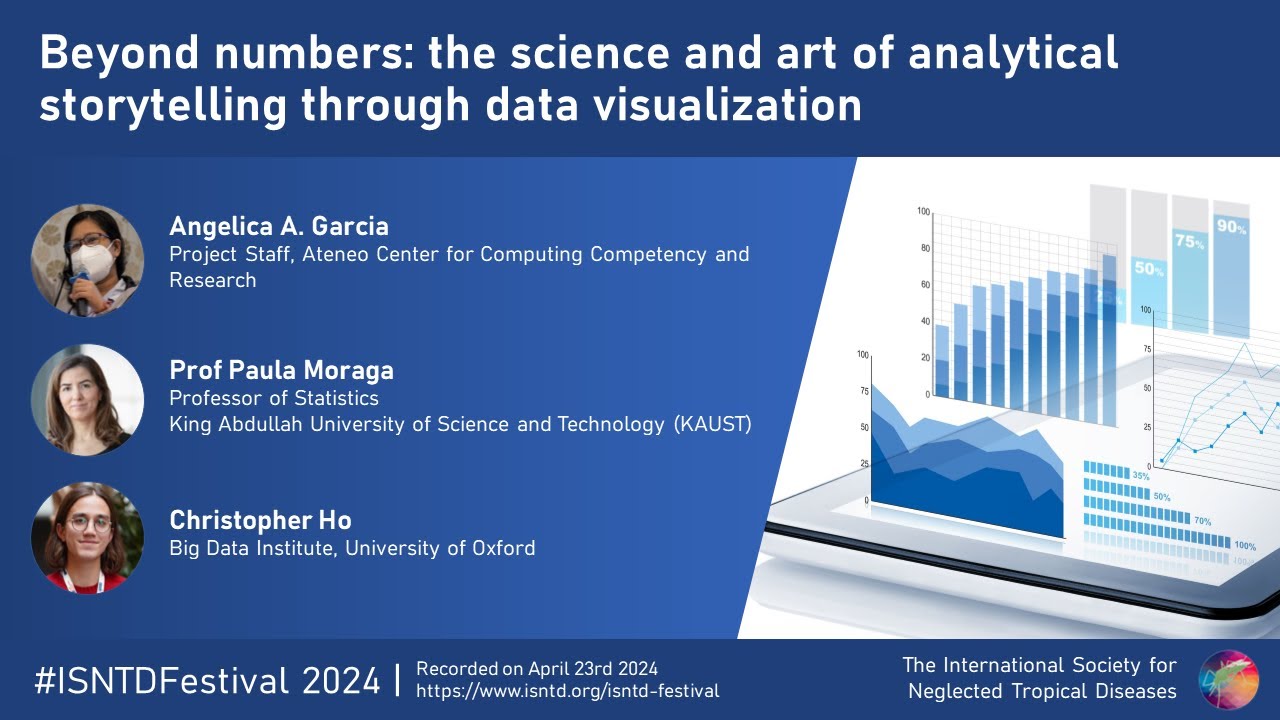
Data visualization: the science and art of analytical storytelling beyond numbers
As part of the ISNTD Festival, this session takes a closer look at examples of data visualization for tropical diseases, and the creative and artistic processes that translate complex data into concrete tools for decision making in public health, with:
Angelica A. Garcia (Project Staff, Ateneo Center for Computing Competency and Research) - how data visualisation impacts data-driven decision-making for public health
Prof Paula Moraga (Professor of Statistics at King Abdullah University of Science and Technology (KAUST)
Christopher Ho (Big Data Institute, University of Oxford) - "Beyond reports: The use of maps in community engagement, examples from SchistoTrack"
Recorded online on April 23rd 2024 as part of the ISNTD Festival 2024, the annual conference by the ISNTD bringing together the creative industries, science communication and tropical diseases.
https://www.isntd.org/isntd-festival