 United Nations ESCAP
93d ago
United Nations ESCAP
93d ago
▶
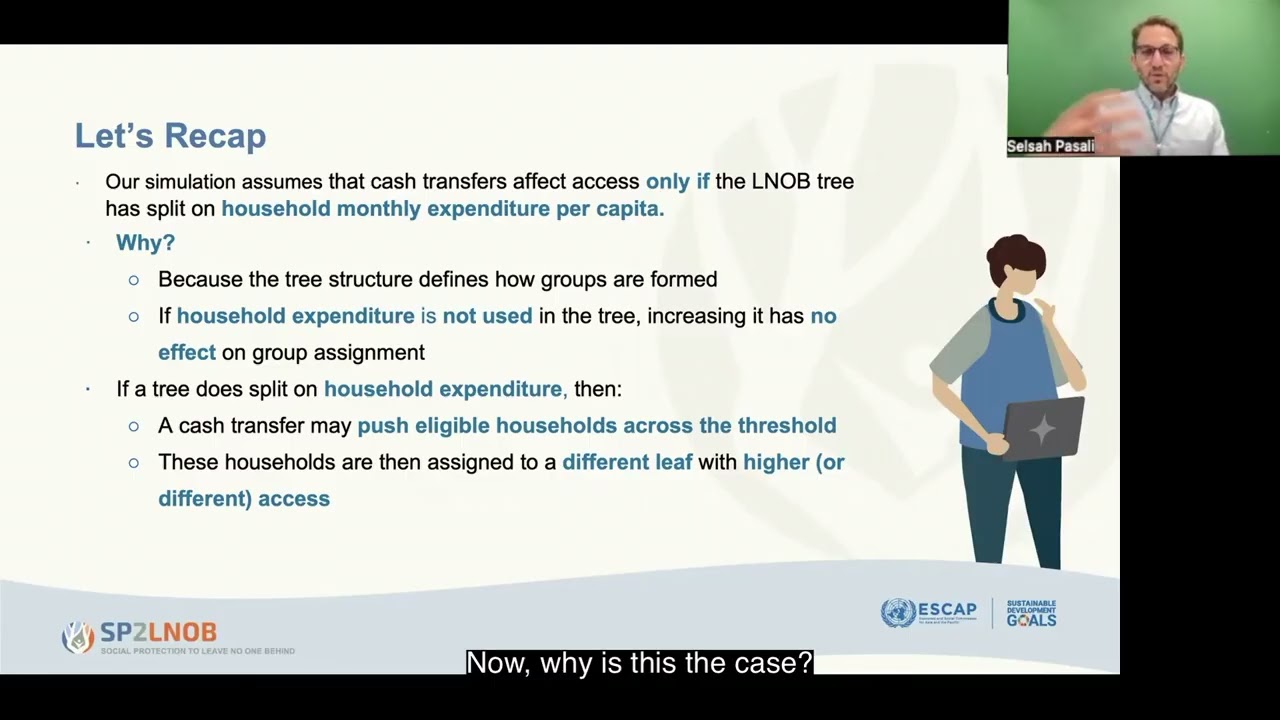
Different Visualizations to Measure Changes
This section visualizes how social protection transfers change outcomes for different groups identified in the LNOB analysis. It walks learners through the movement of youth across expenditure and education-completion thresholds, showing how many transition out of the furthest behind group and into higher-opportunity groups after receiving support. By illustrating these shifts, the section helps make complex distributional effects intuitive and demonstrates how social protection can significantly reduce the size of groups left behind.
Moderator: Selsah Pasali