Without good data...| #DataFest2026 #KSEC2026 vox pop

Behind every data system, there is a purpose and a person. At the Global Data Festival 2026 in Nairobi, we put two questions to the people in the room: what happens without good data, and who this ...
One word to describe #DataFest2026

We asked participants at the Global Data Festival 2026 to describe the week in just one word. Diplomats, data scientists, statisticians, policymakers, humanitarians, and advocates from around the w...

Making data ready for #AI starts with a question: can people understand what a number means, where it came from & how to use it?
@OECD Chief Statistician Steve MacFeely asks @Google's Prem Ram...
... AI systems need data that is well sourced, auditable and reproducible, and why statistical organisations should start with machine-readable metadata.
The conversation also ex...

Pathfinder Pakistan - Qadam Ba Qadam
How do official statistics remain visible, trusted and understood in the #AI era?
In Episode 1 of our new podcast miniseries, #oecd Chief Statistician Steve MacFeely talks with Canada’s Chief Sta...
...citizens, journalists and policymakers find facts. Instead of going directly to statistical databases, more users are turning to AI assistants and chatbots to retrieve, interpr...

Did you know? Every data point tells a story. Health statistics help countries track progress, strengthen health systems, and save lives.
Here's what you need to know about the World Health Statis...

Looking for stats on US immigration? We’ve got you covered.
Get up to speed with our guide to the Frequently Requested Statistics on Immigrants and Immigration.

Visit our website: www.oecd.org/cfe
Follow us on Twitter: @OECD_local

Learn how to review data element completeness when the expected number of reports are used as the denominator in the indicator calculation.

Learn how to review data element completeness when the expected number of reports are used as the denominator in the indicator calculation.


Learn how to compare values collected during data entry with a generated statistical threshold in both data visualizer and during validation rules analysis.

...ew how validation rules can be used to compare internally collected values to a statistical threshold. This method of analysis allows for the identification of outliers.
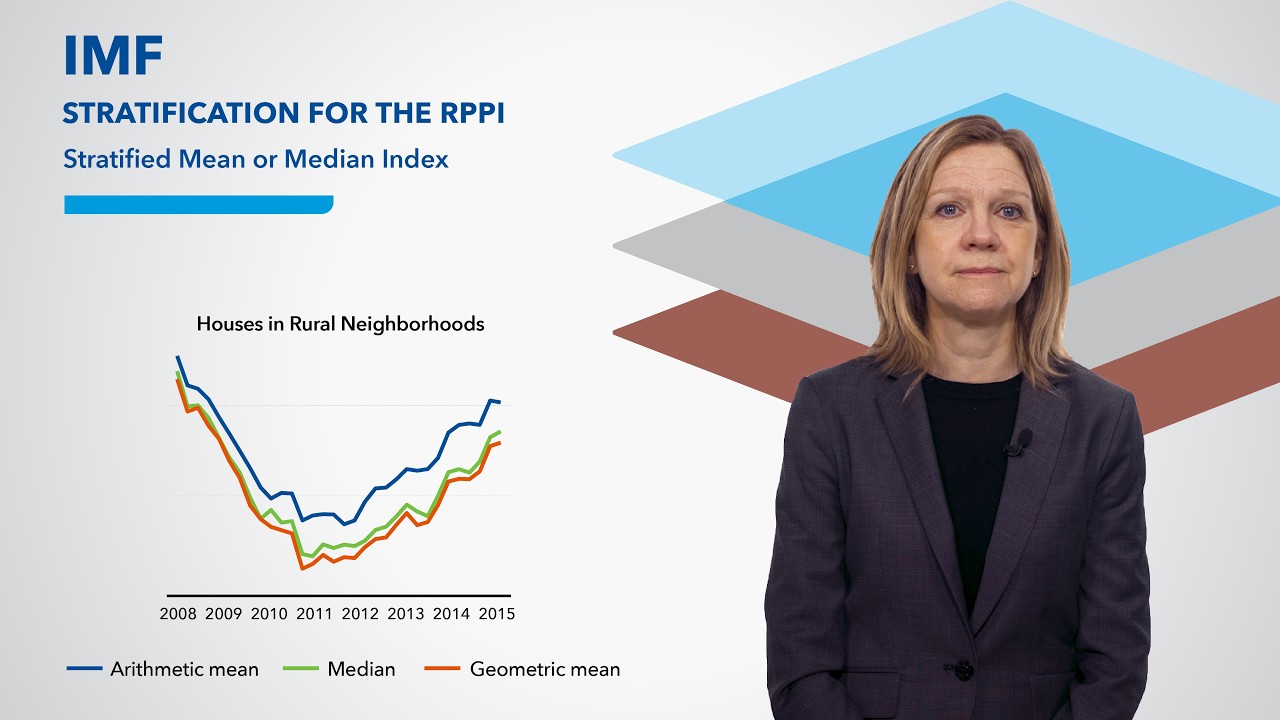
This video demonstrates how to compile RPPI using stratified mean or median indices and fixed-weight aggregation.

The Asia-Pacific Stats Café Series on “Lessons learned from AI pilot initiatives: what worked, what didn’t work, and why” was held virtually on 30 March 2026 (13:00–14:30, UTC+7). This session brou...

This video outlines best practices for disseminating RPPI results, including statistical releases, data accessibility, and documentation of compilation methods.
Lecture 17: Static Visualization II: Statistical Distributions with ggplot2
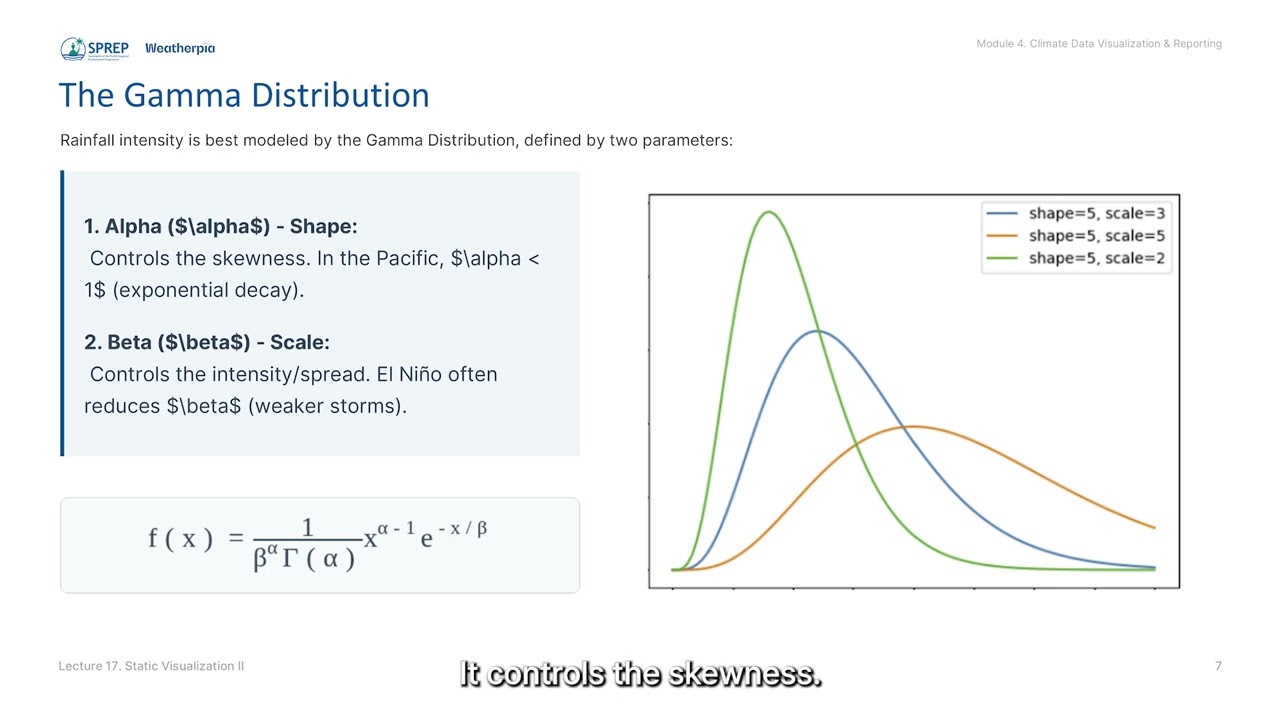
Covers the advanced use of the Python and R visualization stacks to handle zero-inflation in climate data and generate distribution-based operational reports