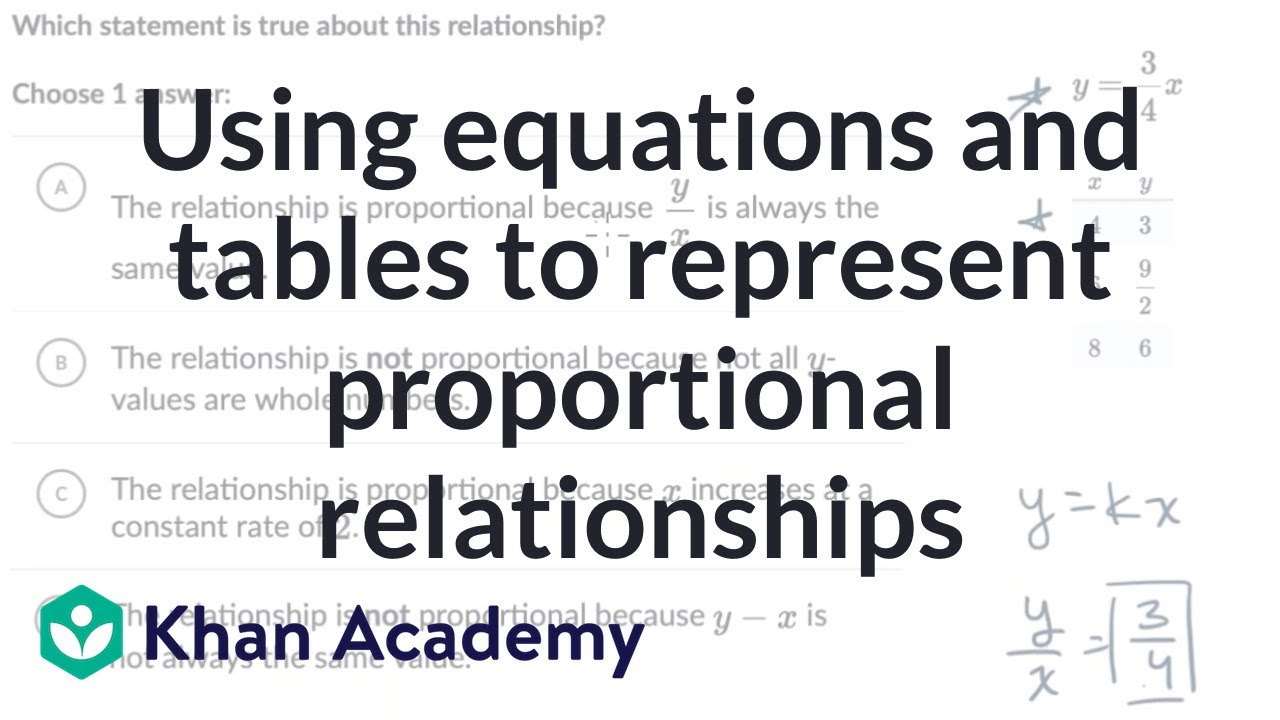
Learn to make connections between equations and tables in proportional relationships.

🟥 DIRECT | DEC : L’évaluation de la journée ville-morte.

🟥 DIRECT | DEC : L’évaluation de la journée ville-morte.

Try out dark mode in your #mWater dashboards with a click of a button.
#datavisualization #sdg6 #tutorial
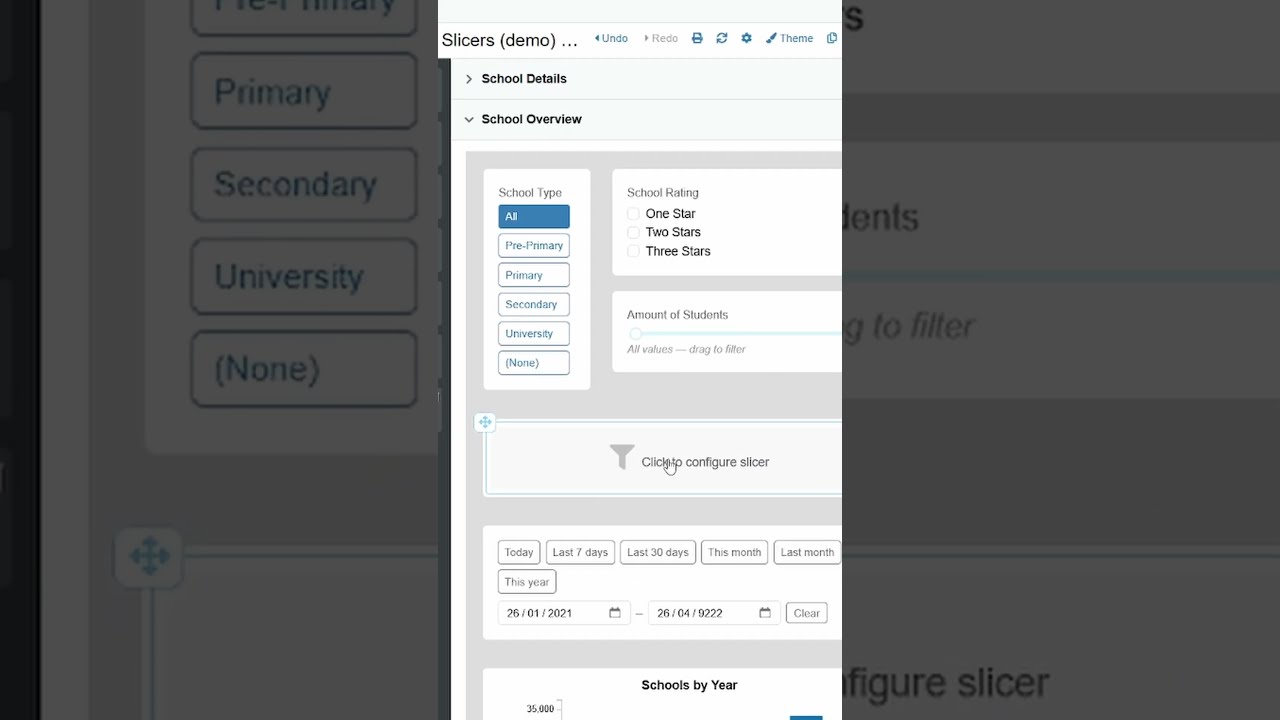
Learn how to make your dashboard more interactive with slicer widgets.
You can allow users to interact with your data by filtering choice fields, custom options, numerical ranges or dates.
#mWat...
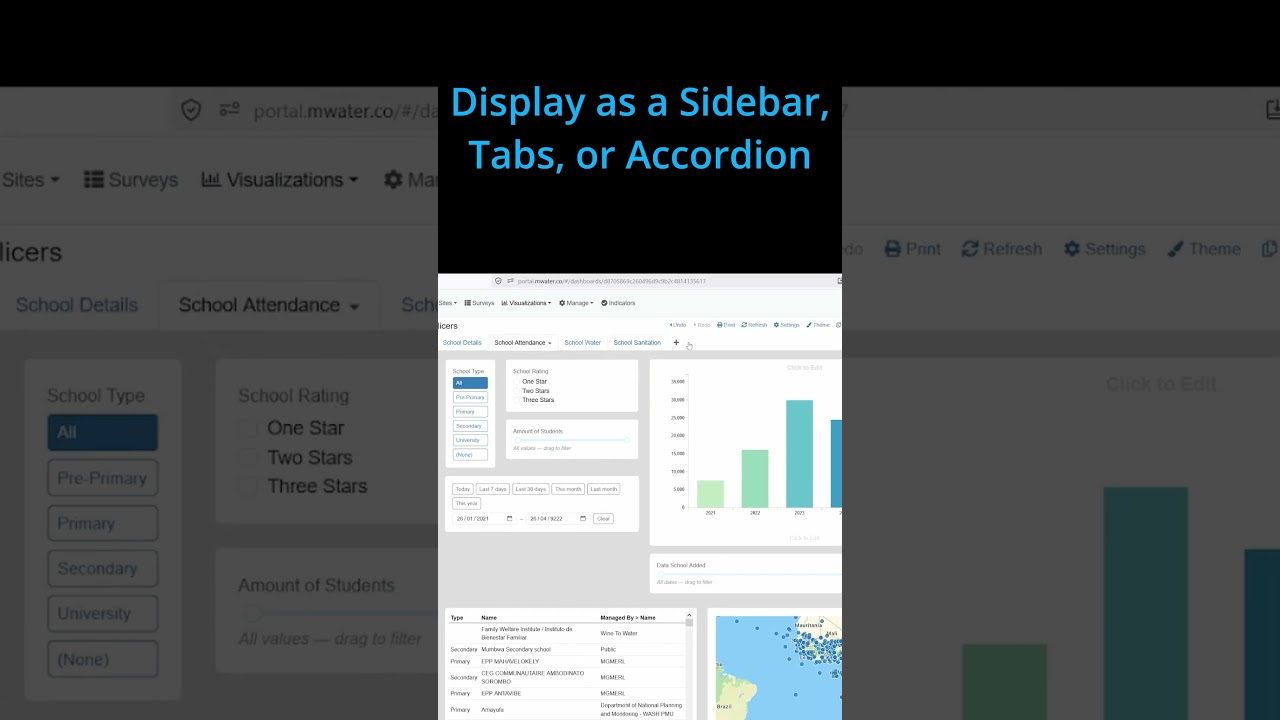
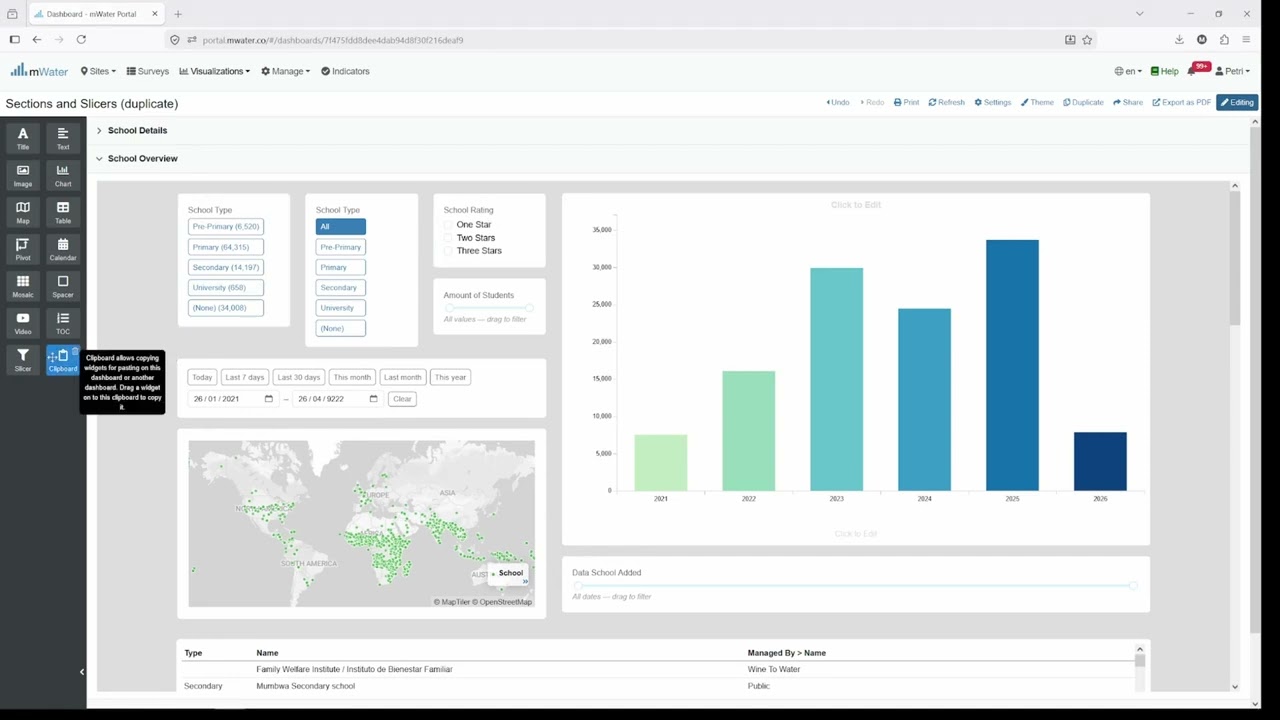
Now you can arrange your dashboards in mWater into Sections: Tabs, Accordion elements, or a Sidebar. Each section loads independently when the user opens it, keeping dashboards nimble, and well-org...

NEW YORK, April 21, 2026 — Mithu Malik, co-owner of Michelin-starred Musaafer; and Jihan Lee, chef partner of Nami Nori and TBD Gimbap explore how Asian cuisine is being reimagined in New York City...


Didier Tabuteau, vice-président du Conseil d'État de la France.

...orer comment analyser efficacement ses données, créer des graphiques, cartes et tableaux de bord clairs, et transformer ainsi les chiffres en décisions éclairées pour ...

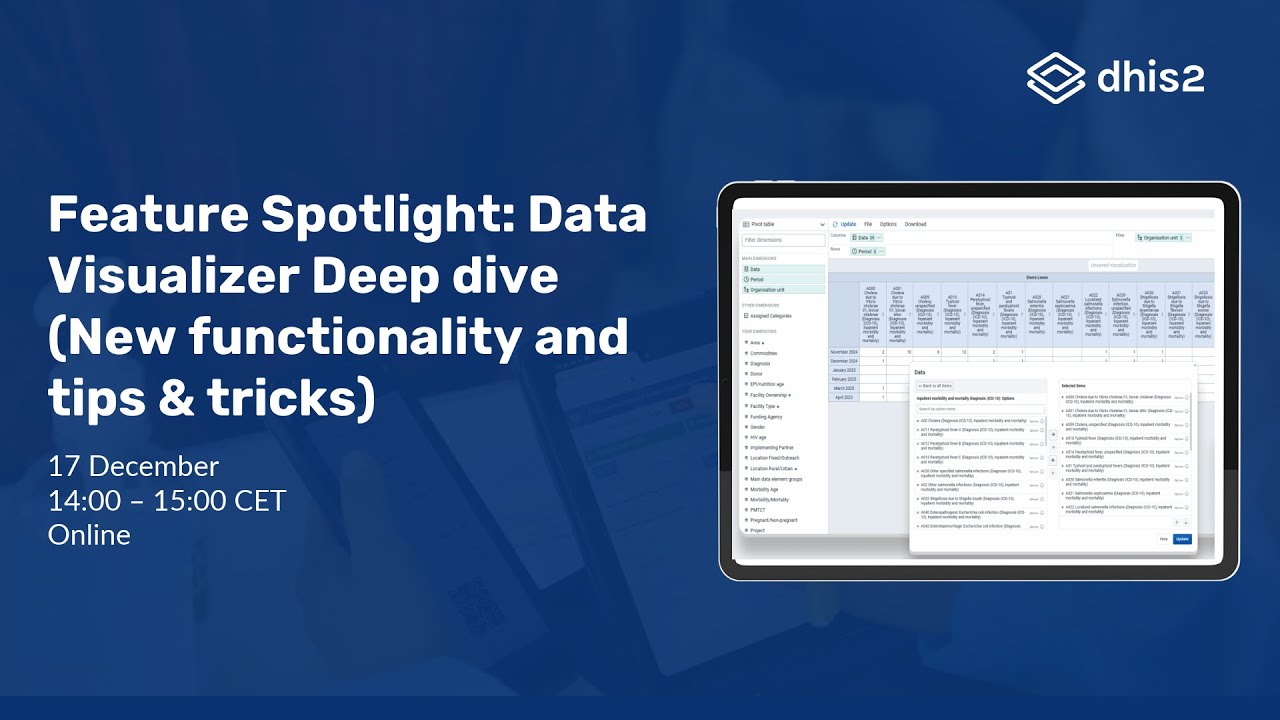
In this webinar, we will highlight recent functionality in the Data Visualizer app, showcasing new and improved ways to explore, analyze, and present your data:
- Data item definitions
- Option...

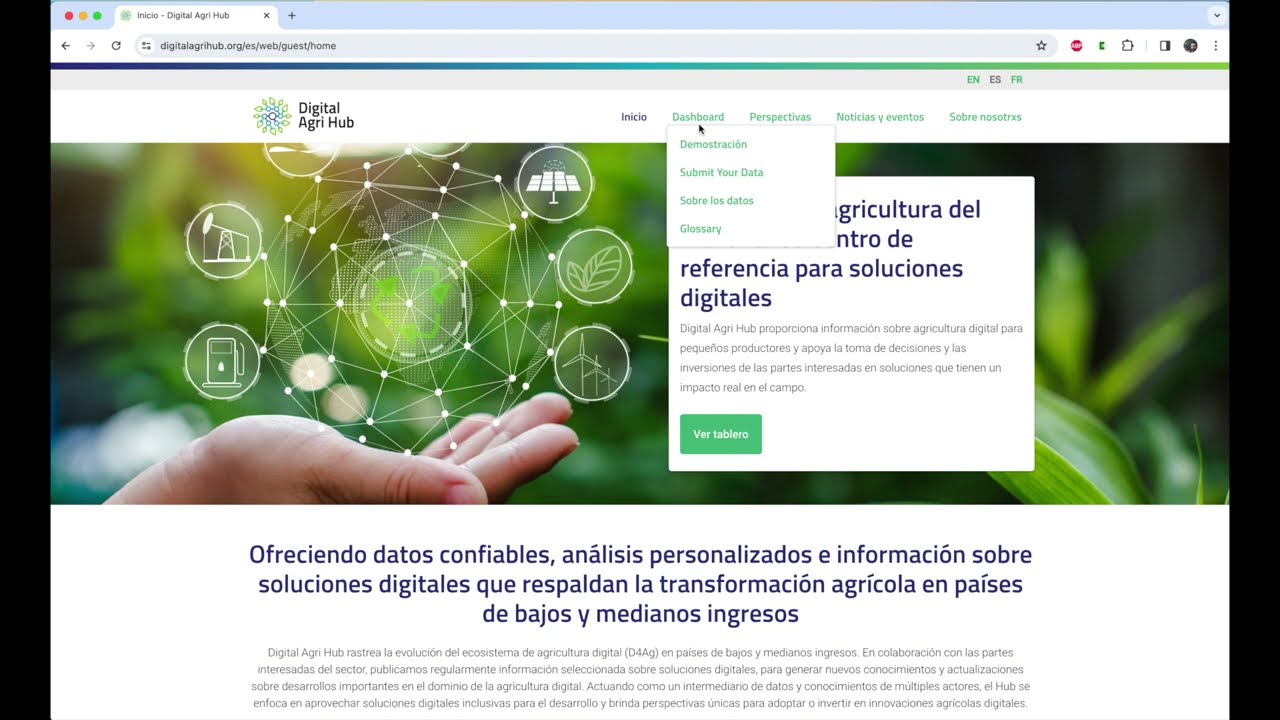
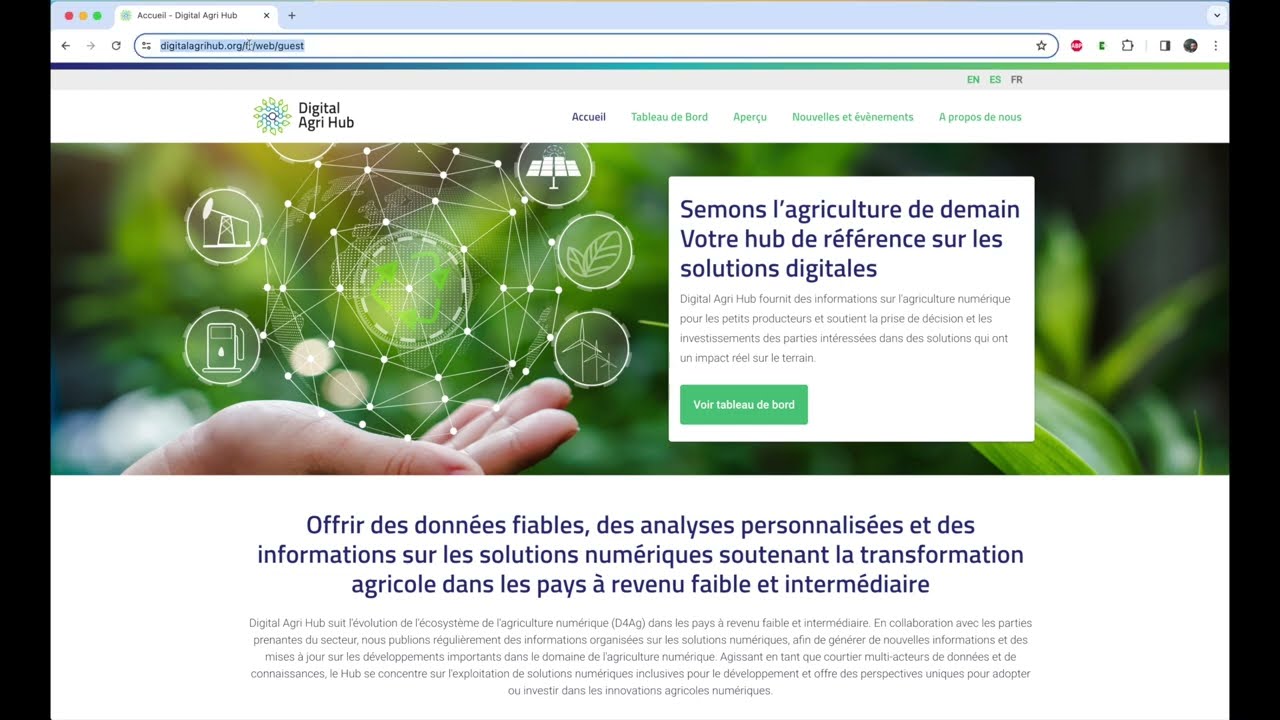
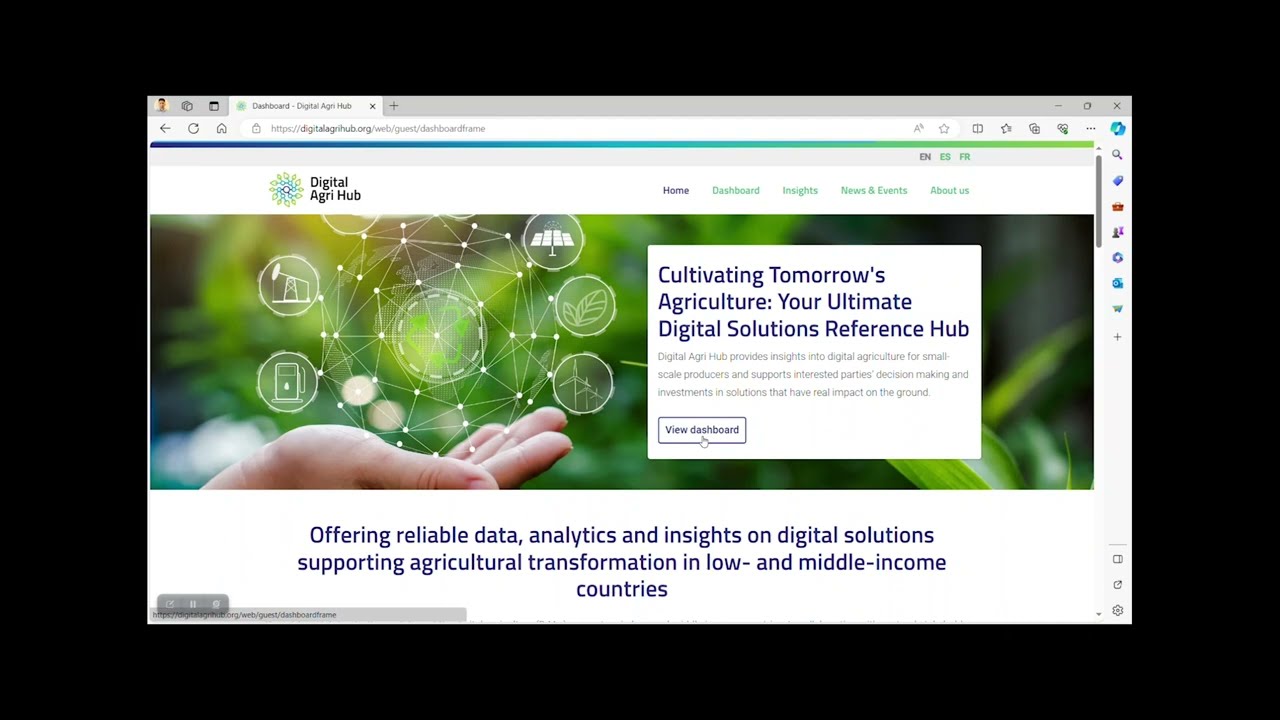
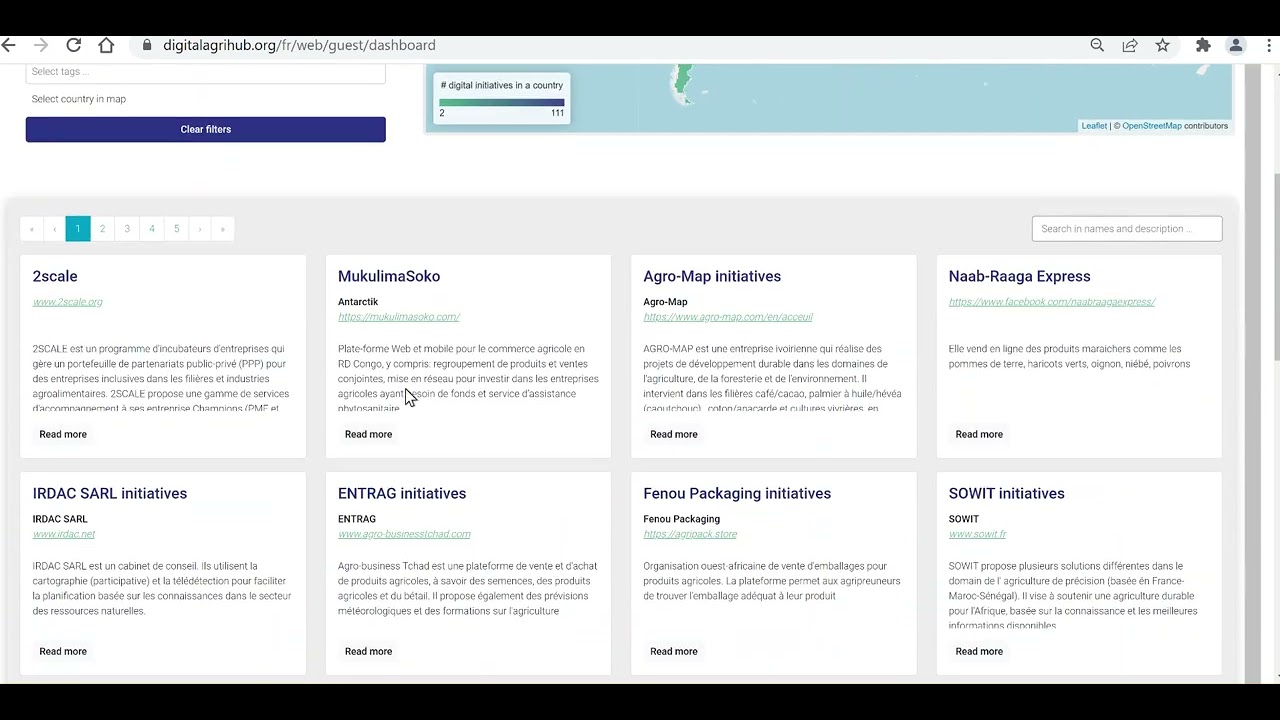
Comment accéder pas à pas au tableau de bord via le site web du Digital Agri Hub