In this webinar Ana Priesto Nemesio and Mario Santa Cruz explain data transformations used for graphical models and its training.
This video is part of ECMWF's co...

In this video, we walk through the CommCare Data Pipeline—a new way to move the data your frontline workers collect into the systems your orga...
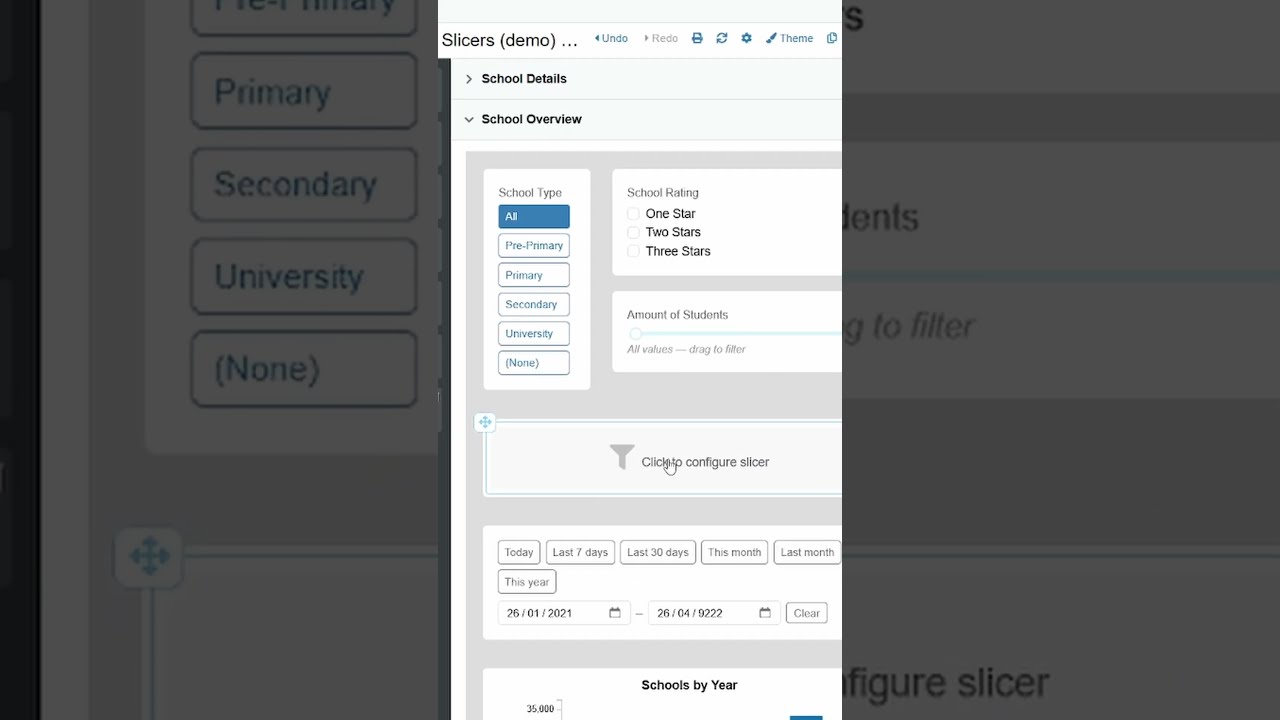
Software Development Vlog #3 | InVEST visual reports
Introducing one of the newest InVEST® features: visual reports. David Fisher, Senior Software Engineer on the Software Team (NatCap), shares background on why we developed this feature, explains ho...

...erence 2026. DHIS2 version 42 features the ability to use a dedicated analytics database, optimized for high query speed and performance, and reduced analytics table update runti...

...Platform, and FHI360 will present a Microsoft Fabric pipeline for DHIS2 tracker data, used for fast tracker-to-aggregate reporting and predictive modelling on HIV outcomes.

... paper, ‘The water footprints of global food and agriculture trade’.
Featuring data visualizations by MA Design for Data Visualisation students at UAL’s London College of Commun...

This is a recording from the DHIS2 Annual Conference 2026. How can Chap and the DHIS2 modeling app bring the power of predictive analysis to your DHIS2 system? Machine learning experts share the vi...

This video captures highlights from the Homa Bay Data Visualization Platform Co-Creation Workshop, where stakeholders reviewed the platform prototy...
...e open-source solutions that help countries integrate, analyze, and use climate data directly within DHIS2 to support climate-sensitive health forecasting, surveillance, and deci...
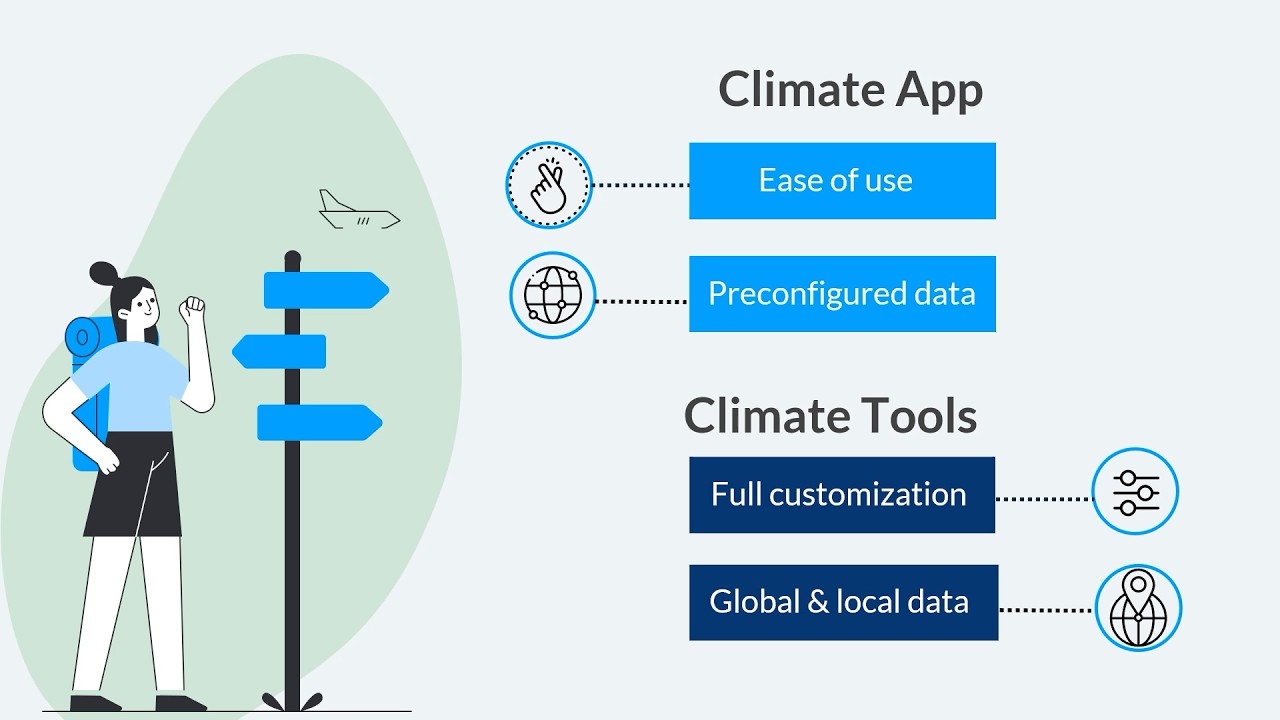
...ovement has been missing: an all-encompassing platform using the best available data to provide decision-makers with actionable, localized intelligence on the most effective clim...
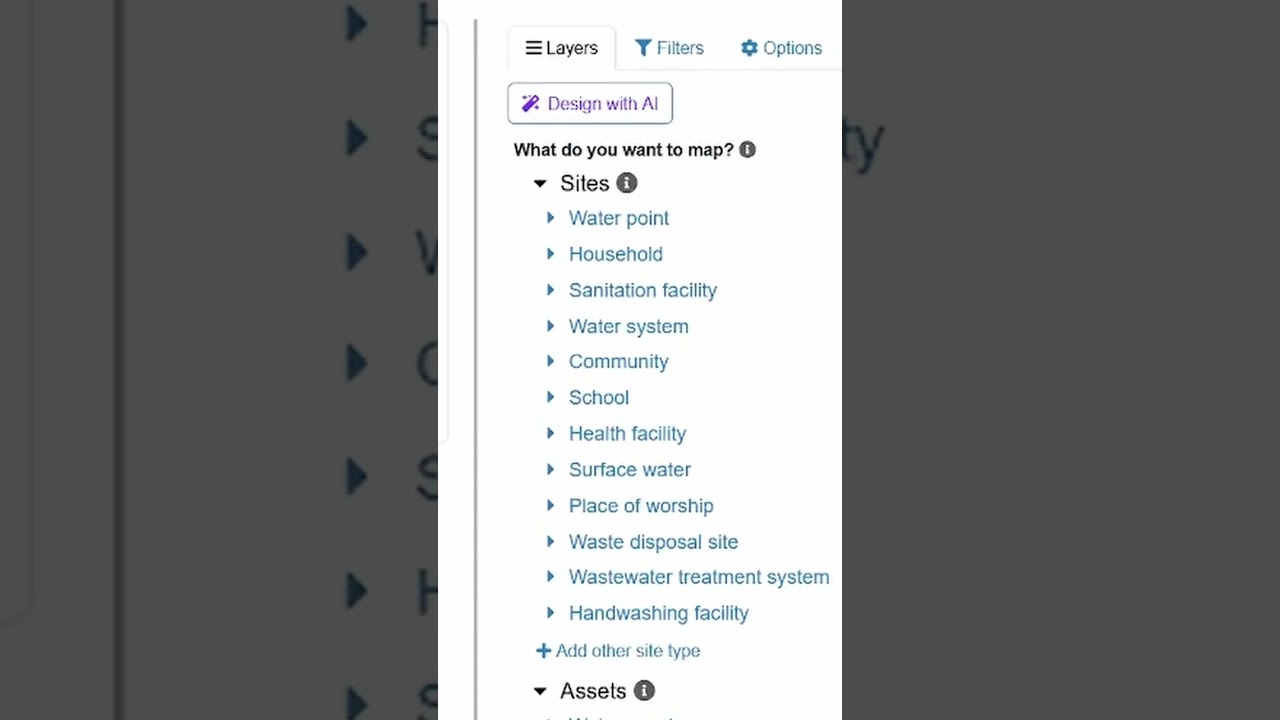
Now you can visualize your water and WASH data just by talking to AI in mWater. Try it out: https://portal.mwater.co

Did you know? Every data point tells a story. Health statistics help countries track progress, strengthen health syste...
In this snippet, we look at how the Claude Agent SDK can transform data analysis by layering it directly over your data warehouse or data lake using Motherduck. Inst...
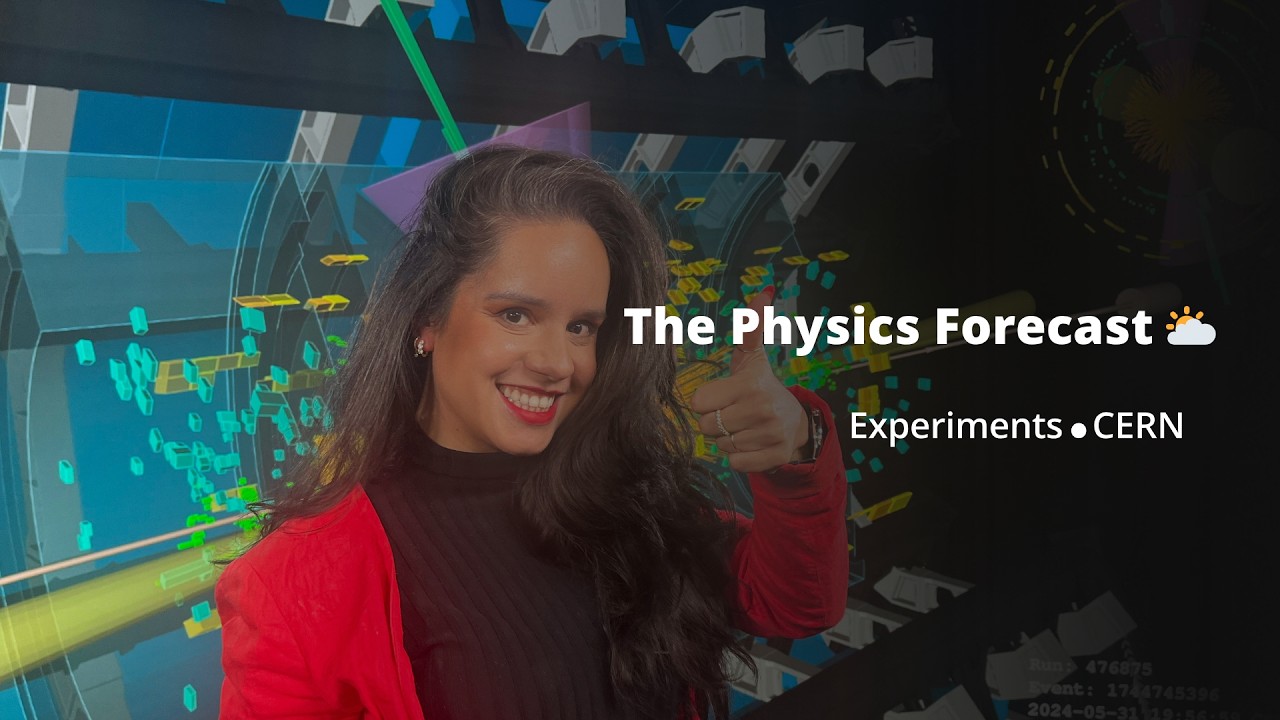
...r, high-energy beams collide in our giant detectors, generating vast amounts of data. This data is visualized through event displays.
To create these displays, experiment teams ...
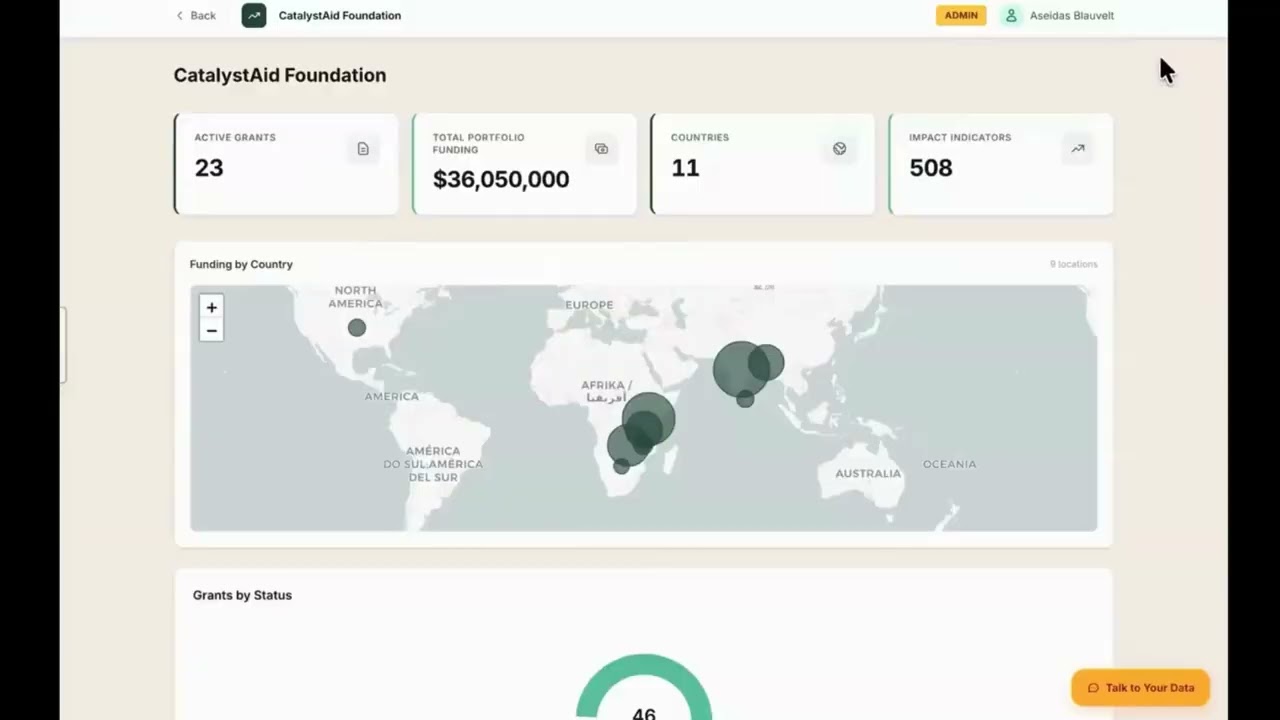
...ional engagement.
Strategic Planning: Prepare for upcoming review sessions with data-backed insights.
Actionable Data: Transform complex statistics into more informed and strateg...

...e than 120,000 human rights recommendations. We’ll show you how to:
1. Explore Data: Navigate four main thematic areas of the ICPD agenda.
2. Identify Groups: Filter through 16...
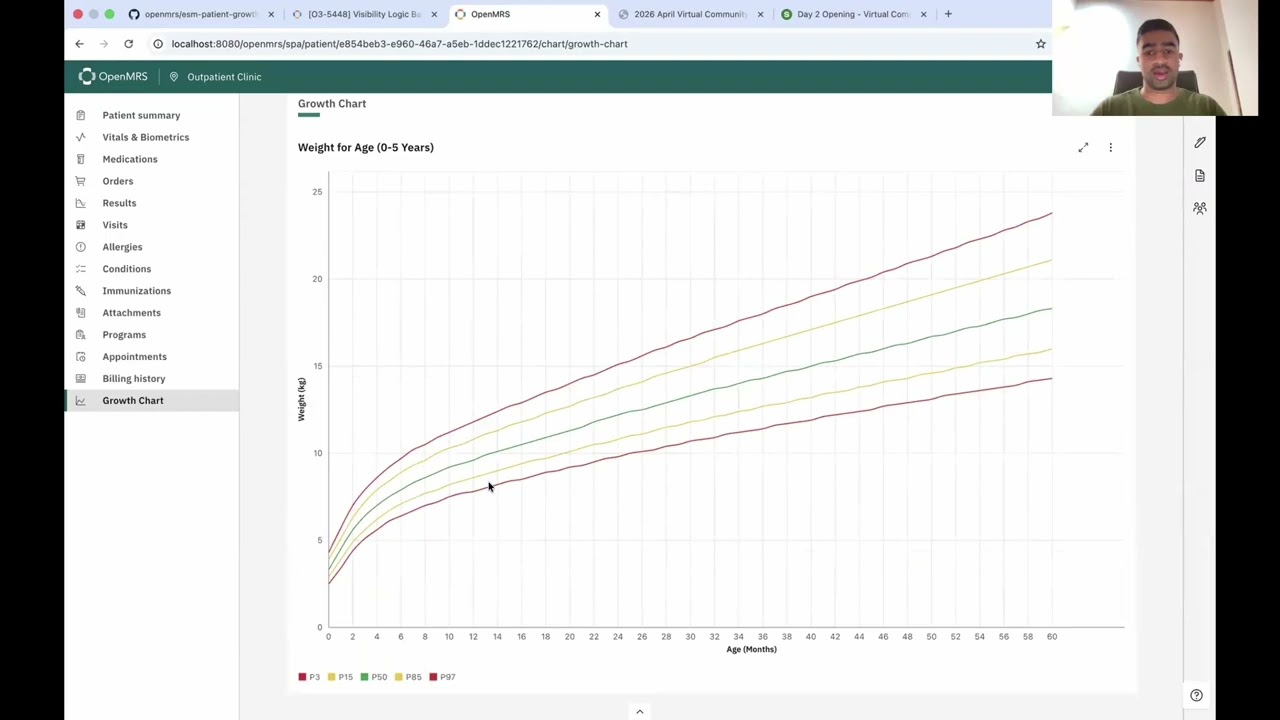
...ight-for-age charts for infants, with gender-aware reference lines, interactive data points, and edge case handling for unknown gender and patients over 5.
Still in active devel...
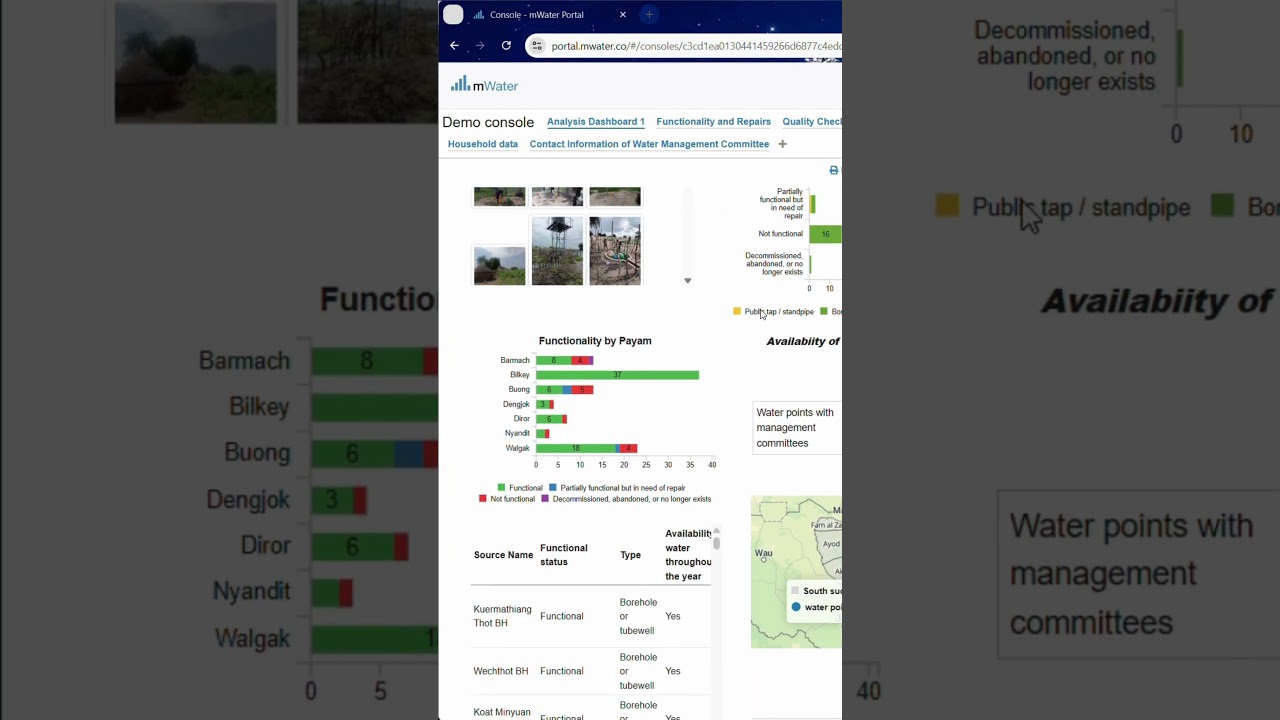
Try out dark mode in your #mWater dashboards with a click of a button.
#datavisualization #sdg6 #tutorial

...oncology outcomes
01:52 What TTNT measures and why it matters in practice
03:54 Dataset and feature design from real-world oncology data
06:03 Survival-informed ML approach (not ...