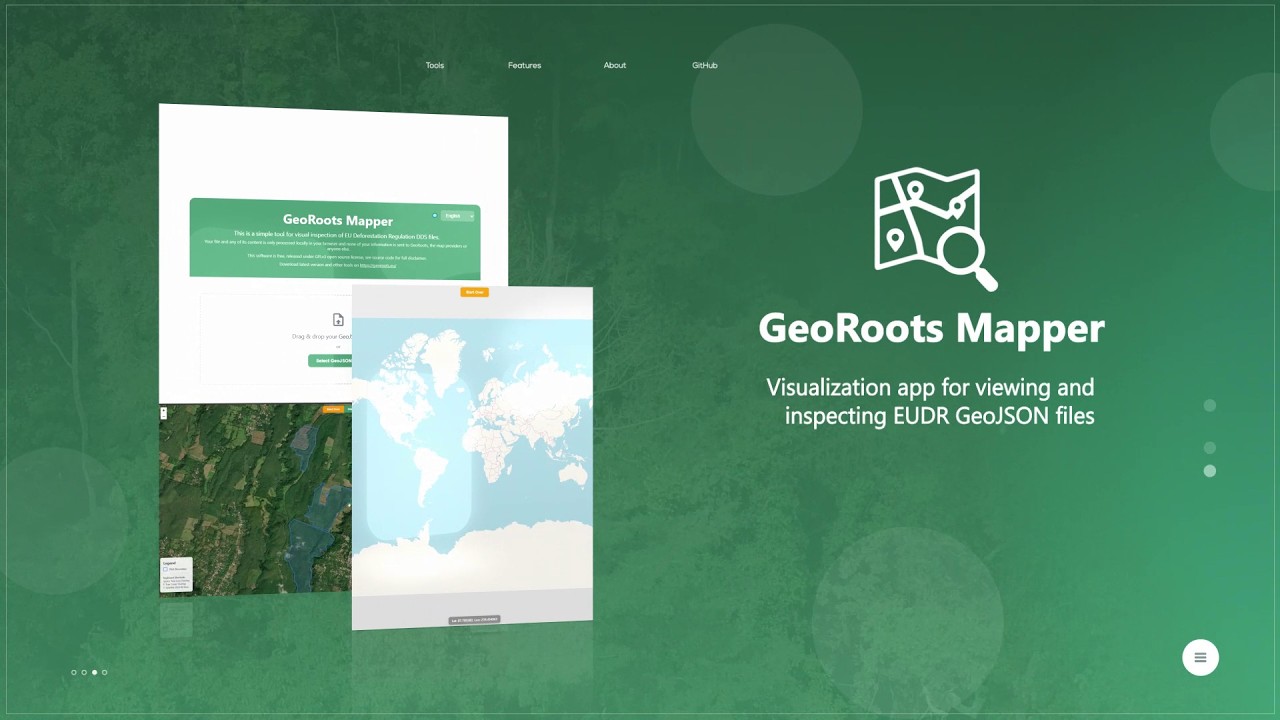
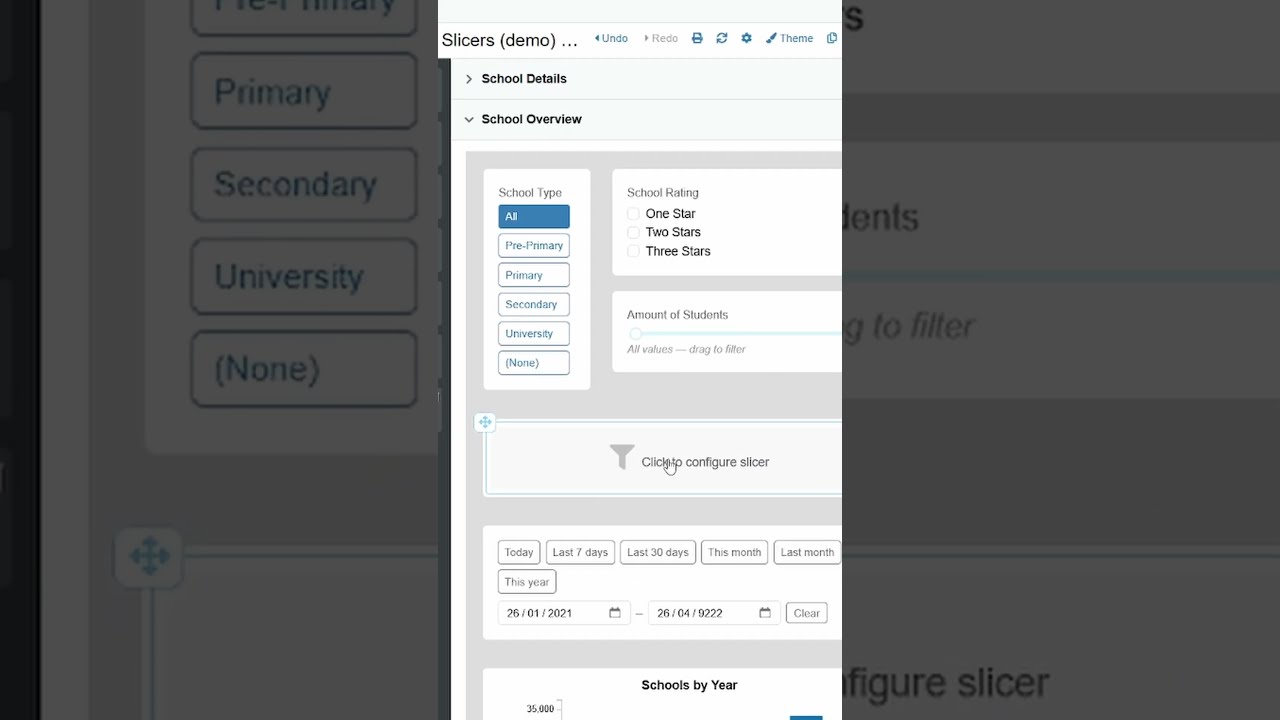
GeoRoots Mapper is a tool for the rapid visualization of GeoJSON files. This video shows how to use the GeoRoots Mapper to quickly load and visualise GeoJSON files (polygons or GPS points) on a map...
Without good data...| #DataFest2026 #KSEC2026 vox pop

Behind every data system, there is a purpose and a person. At the Global Data Festival 2026 in Nairobi, we put two questions to the people in the room: what happens without good data, and who this ...
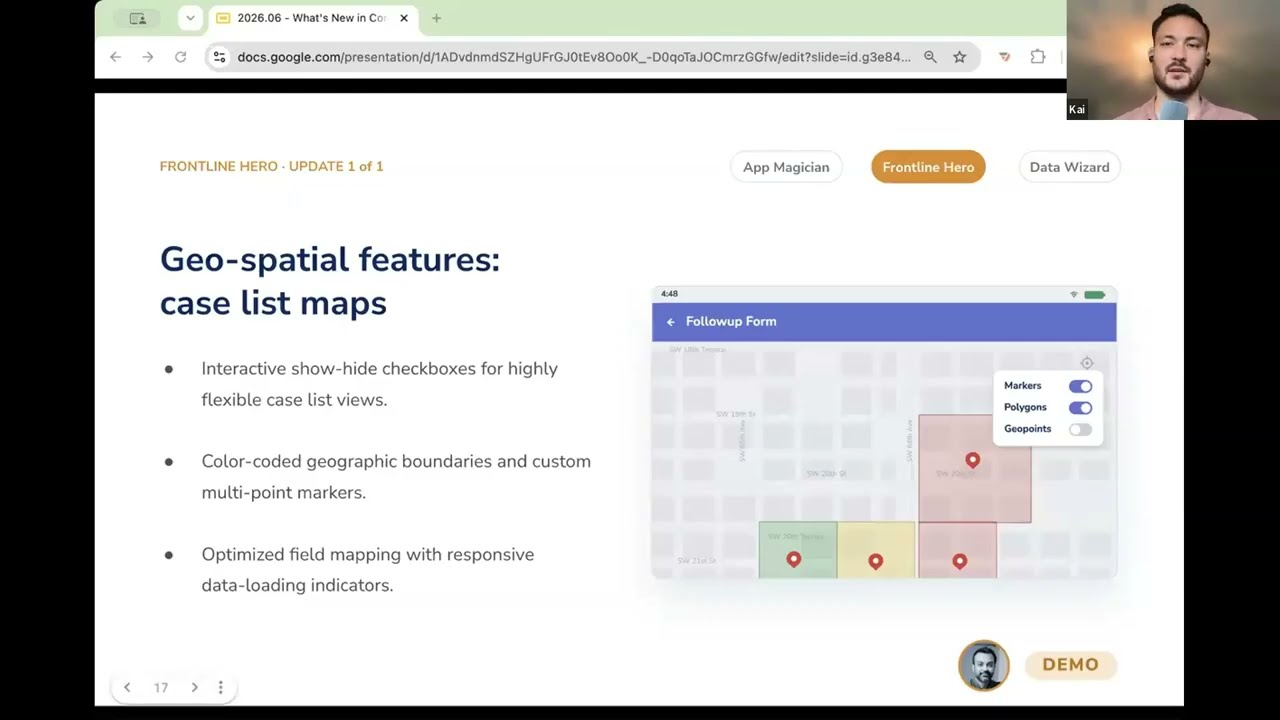
In this video, you get a demo of CommCare's geospatial feature upgrades that turn a frontline worker's case list into an interactive map. I...
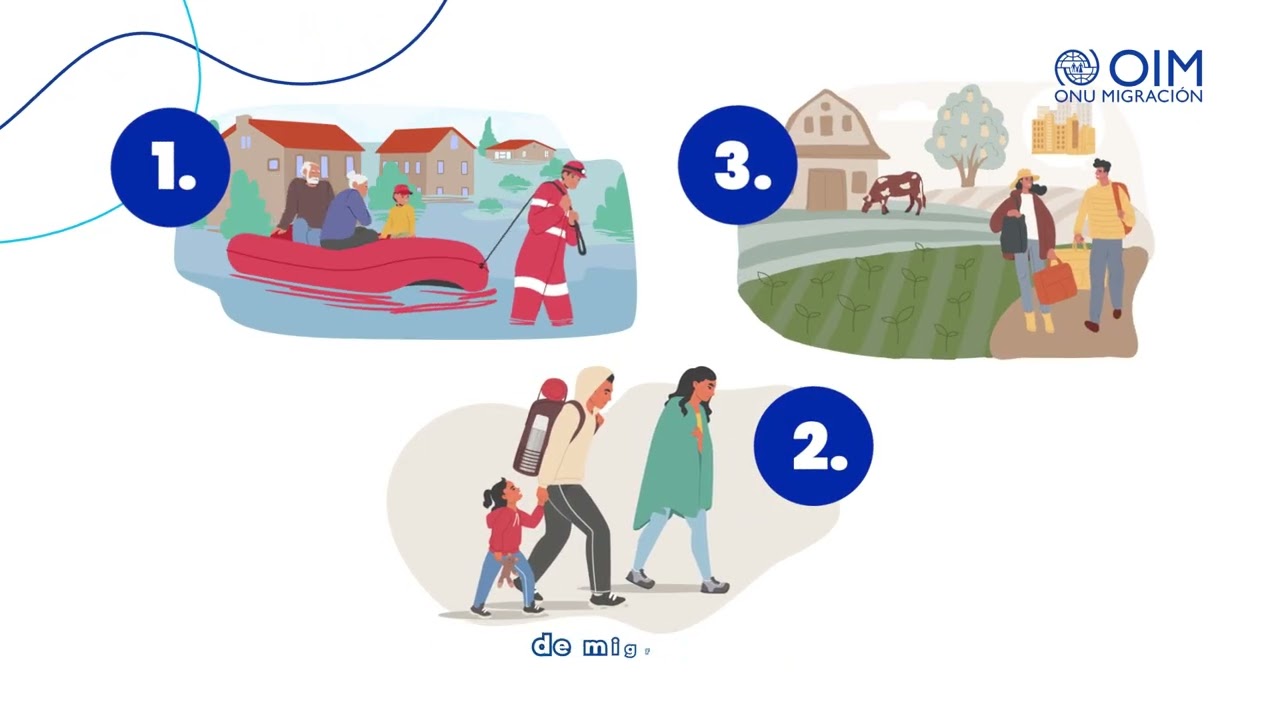
📉 La Matriz de Seguimiento de Desplazamiento (DTM) transforma datos en respuestas humanitarias.
Descubre como funciona en el siguiente #short

This is a recording from the DHIS2 Annual Conference 2026. In this session, we will explore the latest functionality and extensions to maps in DHIS2.
World Pop, Crosscut, ESRI / ArxcGIS, and the ...
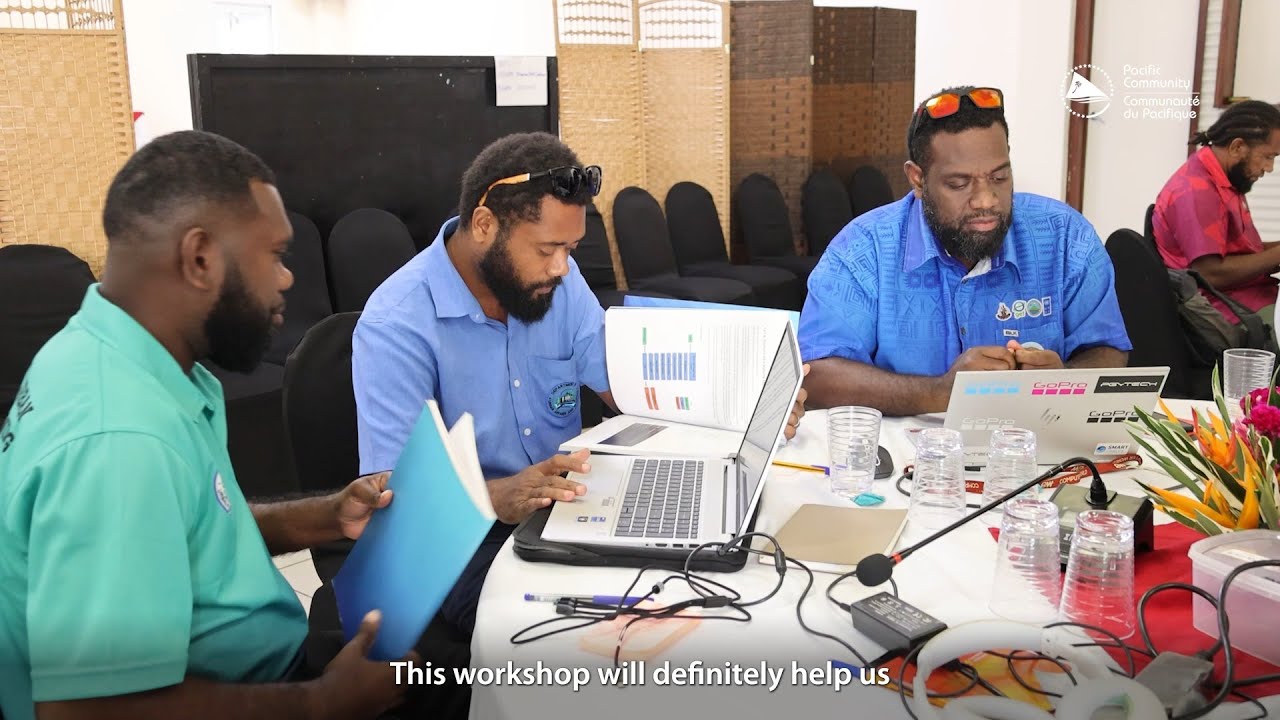
...fic Community (SPC) under the National Surveys for Infrastructure Resilience Geospatial Databases to Support Exposure Modelling Project is supporting Vanuatu through a tech...
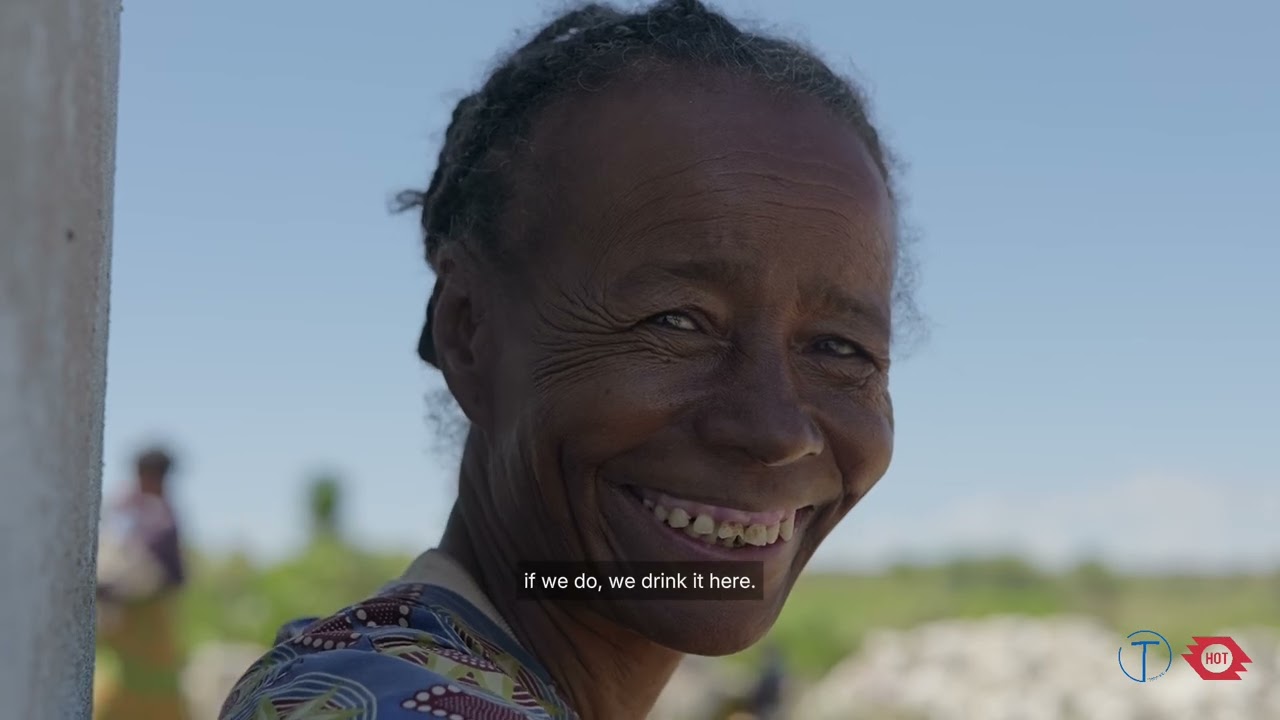
...ng local organizations in Eastern and Southern Africa to create and use open geospatial data for humanitarian and development purposes and to build solutions that could out...

...ern and Southern Africa.
In this video, we explore:
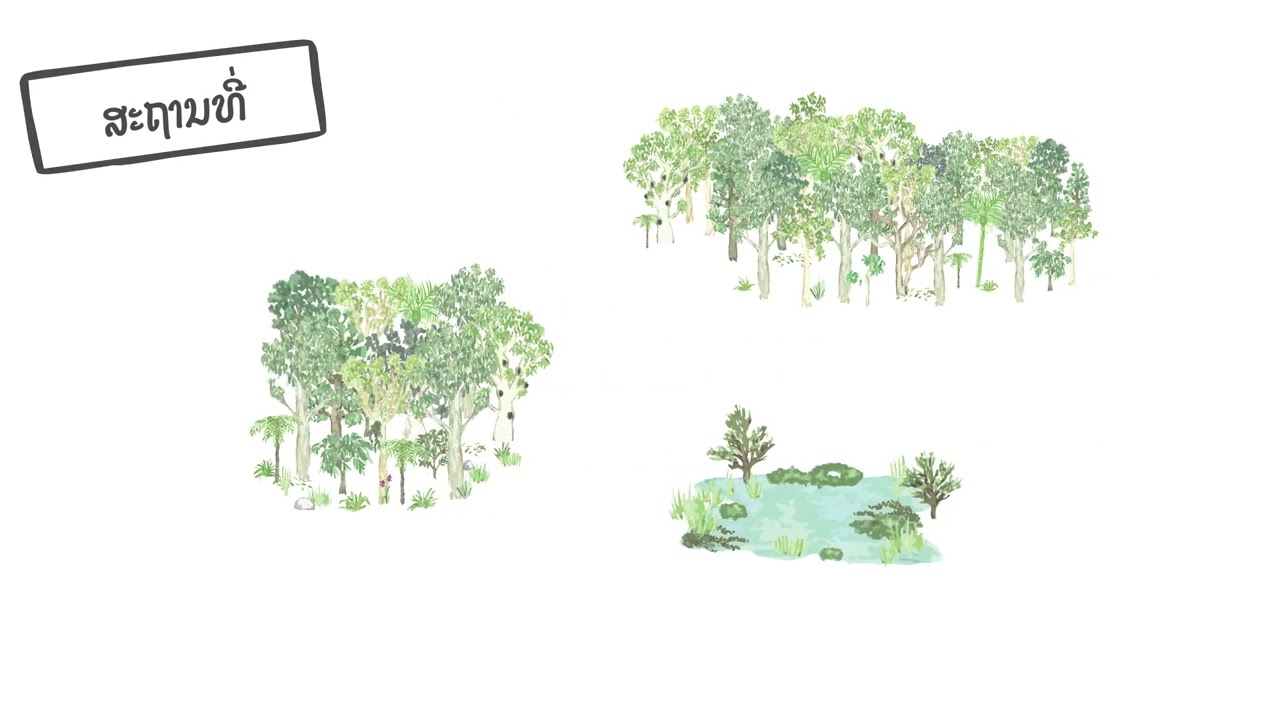
1. How countries translate spatial data into updated National Biodiversity Strategies and Action Plans (NBSAPs)
2. The ...
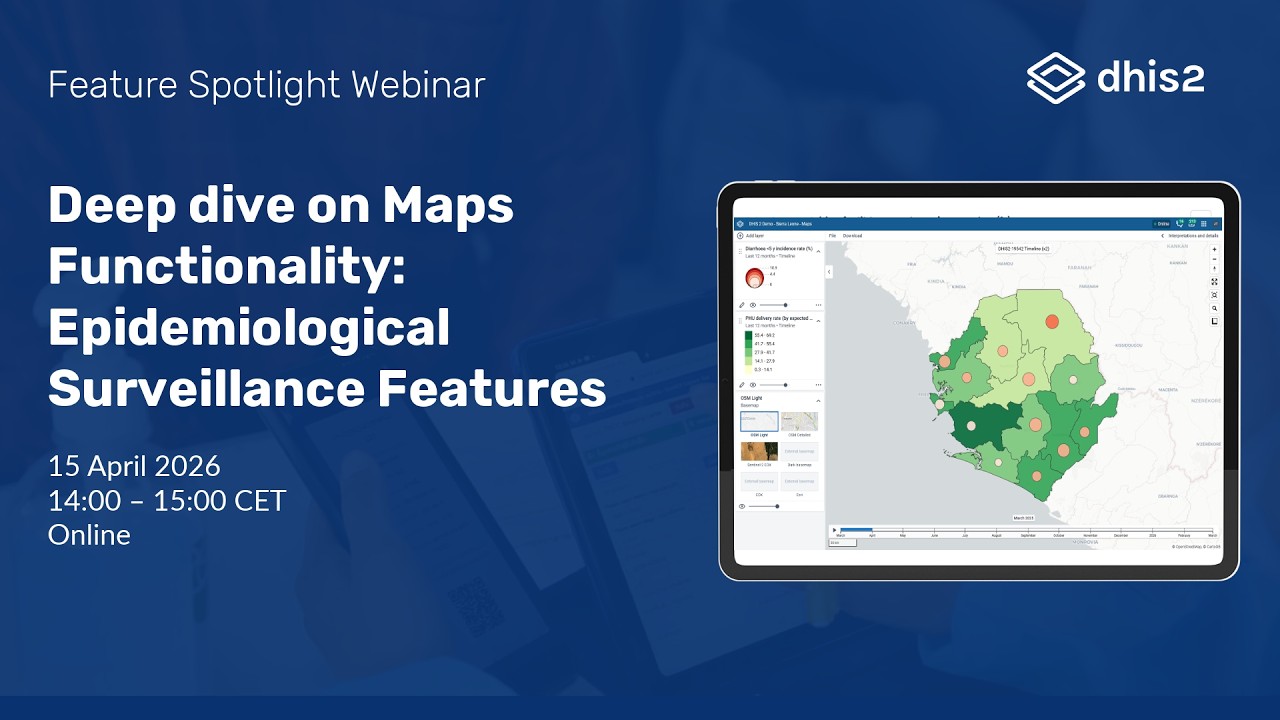
In this Feature Spotlight webinar, we will take a deep dive into the Maps app, which is a powerful tool for exploring, analyzing, and visualizing data geographically. Using examples from epidemiolo...
Data Infrastructure for Development 2026 Recap

DID 2026 convened African and global leaders to highlight how GIS, remote sensing, mobile data, and emerging computational methods can transform decision-making across sectors—from agriculture and ...
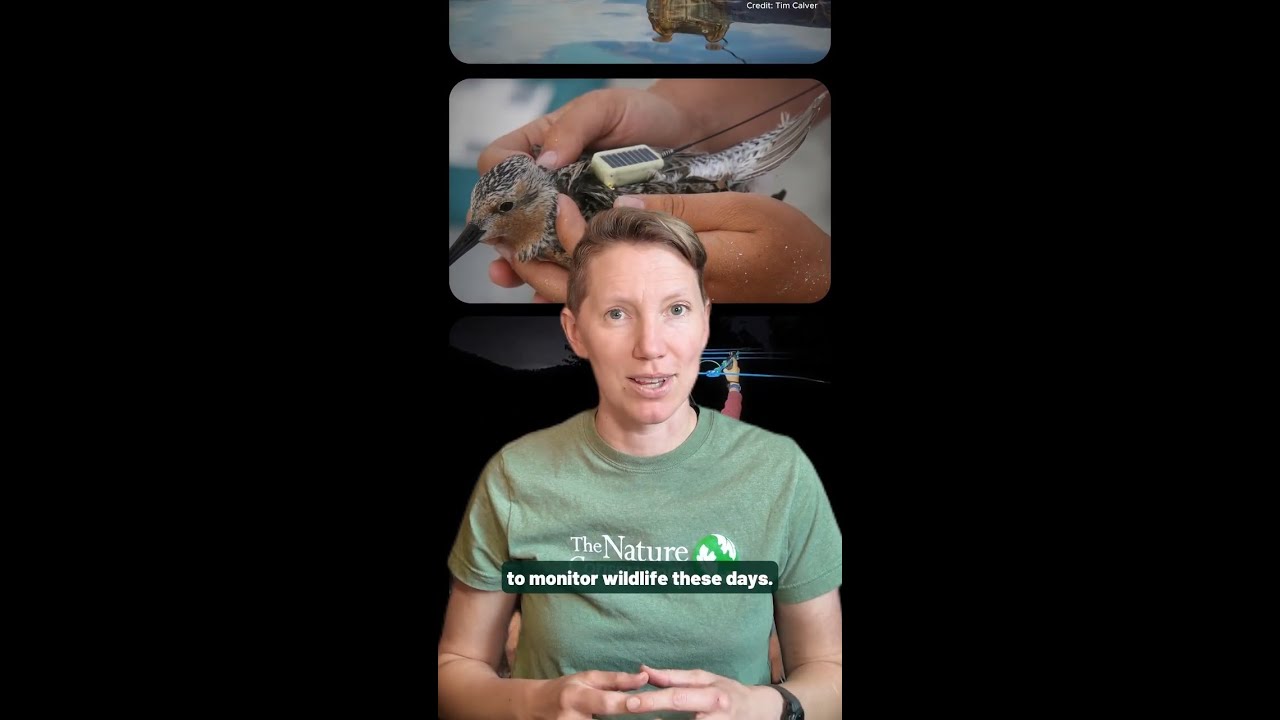
Read about 8 examples of wildlife data being put to good use for nature: https://nature.ly/mapping-migrations
Because these days, scientists are tracking wildlife using tech that sounds straight ...
How to open the attribute table and perform a query in the GGMN & GGIS?
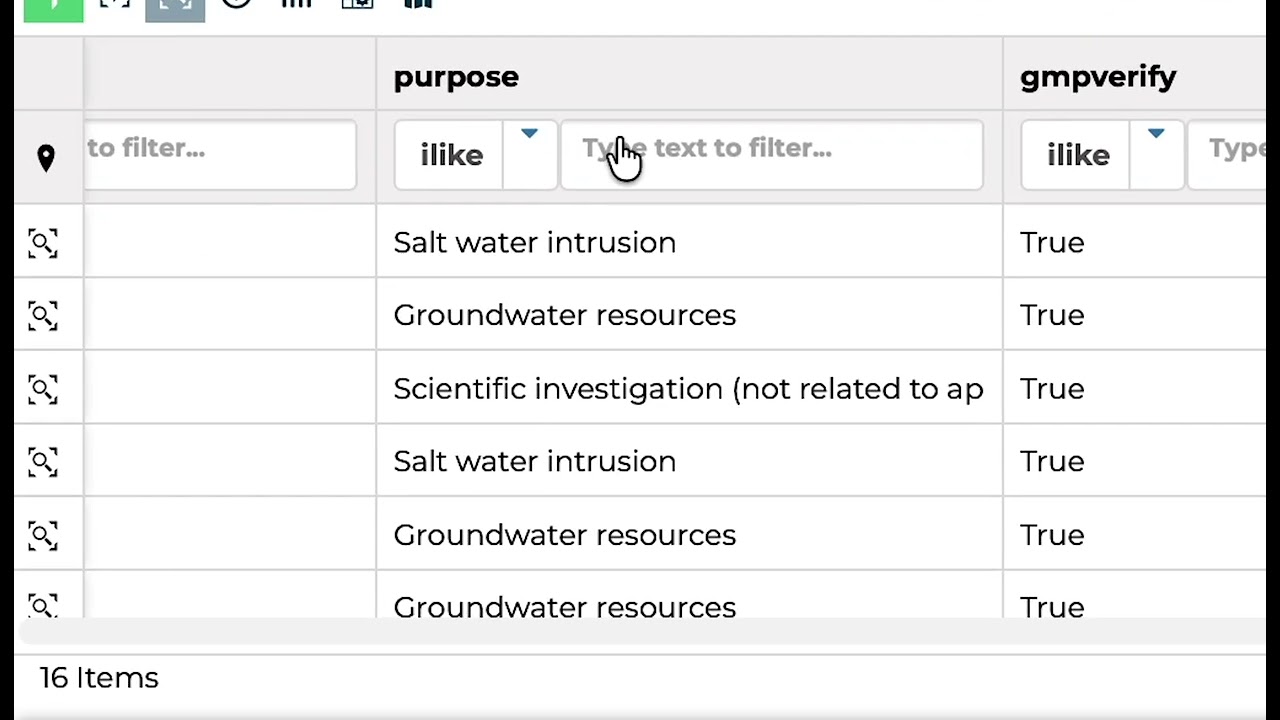
In this tutorial, we will walk you through all the steps to open the attribute table and perform a query in IGRAC's GGMN (Global Groundwater Monitoring Network) & GGIS (Global Groundwater Infor...
How to download a layer in the GGMN & GGIS?
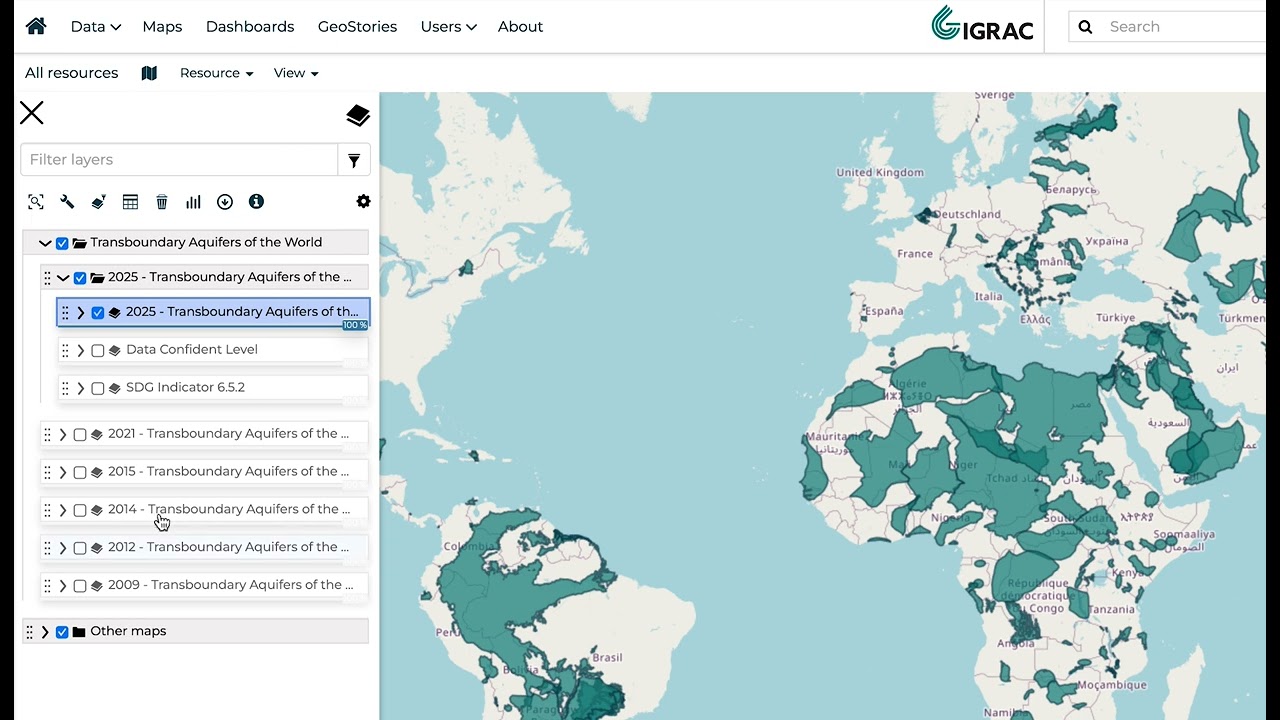
In this tutorial, we will walk you through all the steps to download a layer IGRAC's GGMN (Global Groundwater Monitoring Network) & GGIS (Global Groundwater Information System).
We will expla...

Join us for an overview of the new WorldPop Global 2 dataset, which is now available in DHIS2. Global 2 provides high-resolution annual population estimates for 2015-2030 at 100x100m resolution wit...
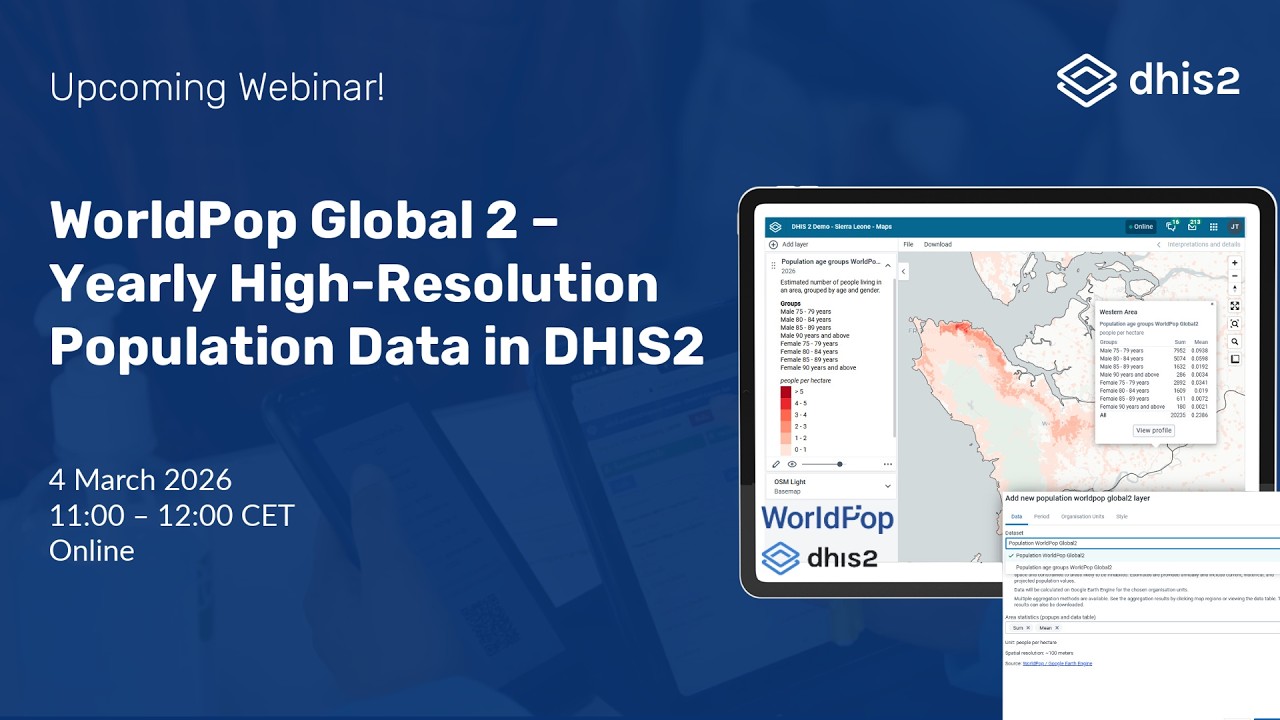
Join us for an overview of the new WorldPop Global 2 dataset, which is now available in DHIS2. Global 2 provides high-resolution annual population estimates for 2015-2030 at 100x100m resolution wit...
Lecture 19: Spatial Visualization II: Advanced Contour & Vector Plotting
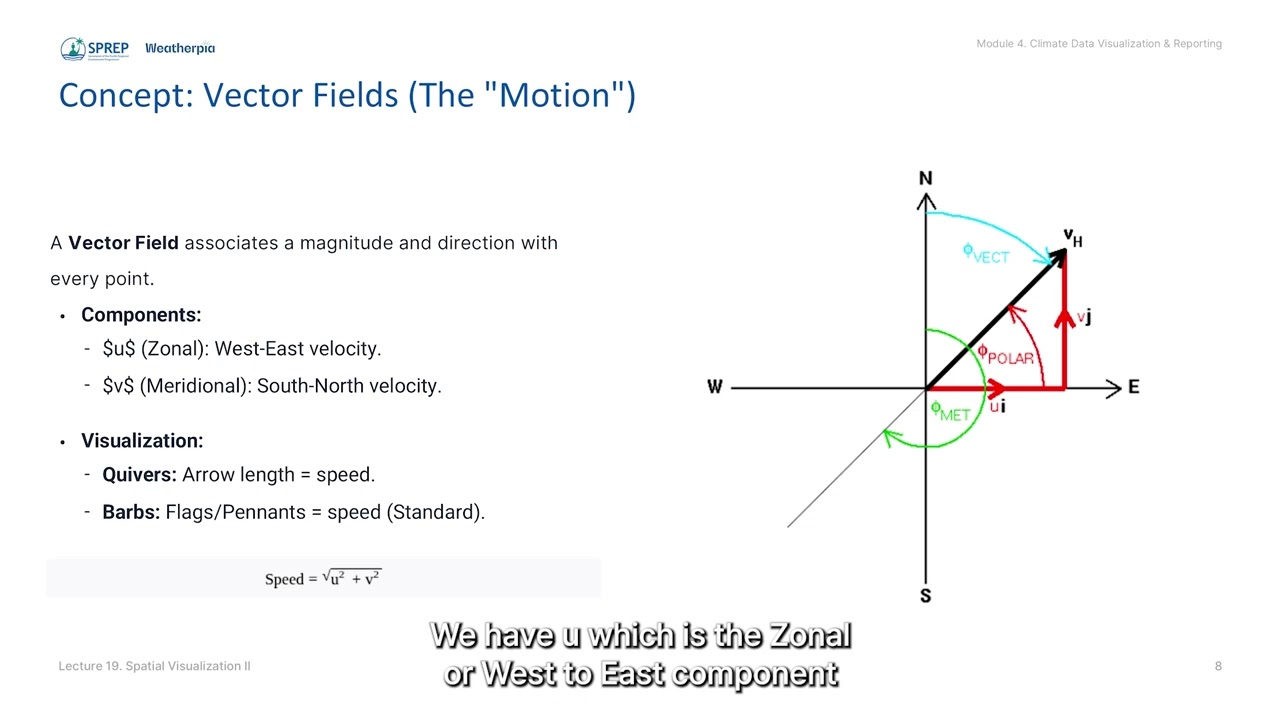
Equips participants with Open Source tools to create advanced spatial maps, aiming to enhance national sovereignty over climate insights.
Lecture 18: Spatial Visualization I: Geographic Mapping with Cartopy/sf
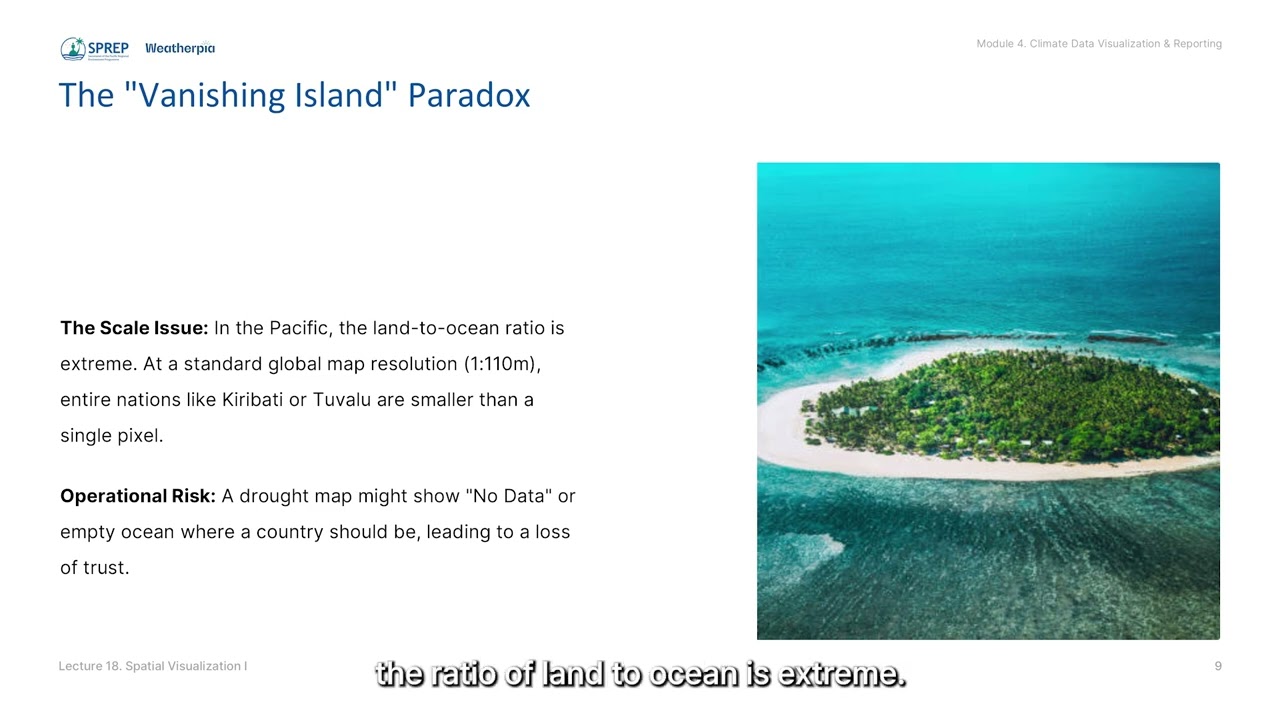
Compares the Object-Oriented approach of Python’s Cartopy against the Grammar of Graphics approach of R’s sf and ggplot2 for powerful control over map projections.